Cape Coral Real Estate Market: July 2026 & August Update
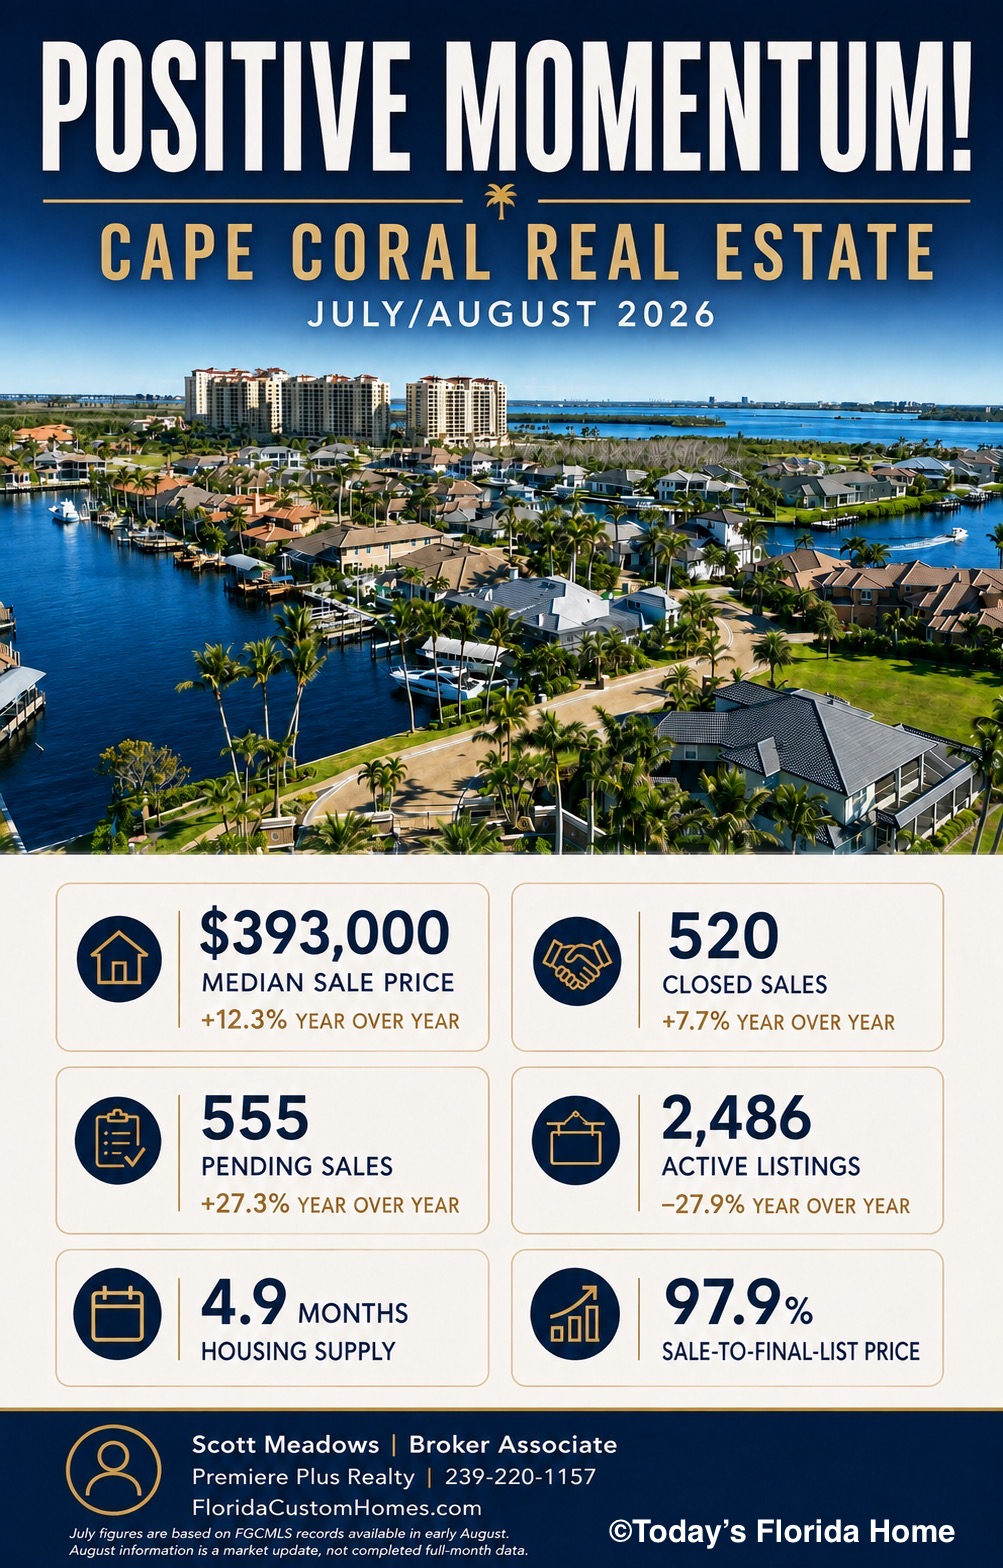
The Cape Coral real estate market showed encouraging improvement in July, with stronger sales activity, higher price measurements and substantially lower inventory than one year earlier. Buyers continue to find opportunities—especially among overpriced or previously listed homes—but the latest figures suggest Cape Coral is moving toward a more balanced market.
July 2026 Cape Coral Market Snapshot
| Market indicator | July 2026 | Year-over-year change |
|---|---|---|
| Median sale price | $393,000 | +12.3% |
| Median price per square foot | $222 | +3.7% |
| Closed sales | 520 | +7.7% |
| Active listings | 2,486 | −27.9% |
| New listings | 678 | −2.4% |
| Pending sales | 555 | +27.3% |
| Months of supply | 4.9 months | −37.2% |
| Sale-to-final-list-price ratio | 97.9% | Increased |
| Median time to contract, successful first attempt | 47 days | — |
Reporting note: July figures reflect Florida Gulf Coast MLS records available in early August and may change slightly as late transactions are entered. August 2026 has not yet concluded, so the August discussion below is a market-direction update rather than a completed monthly statistical comparison.
Cape Coral Home Prices Strengthened
Cape Coral’s median sale price reached $393,000 in July, 12.3% higher than in July 2025. Median price per square foot increased 3.7% to $222.
This does not mean every Cape Coral home appreciated by 12.3%. A monthly median can change when the mix of properties sold shifts toward waterfront, newer or higher-amenity homes. However, the concurrent increase in price per square foot indicates that July’s improvement was broader than a change in the median alone.
Sales and Pending Contracts Increased
Cape Coral recorded approximately 520 closed sales in July, an increase of 7.7% from the prior year. Pending sales rose by an even stronger 27.3%, reaching 555 contracts.
The increase in pending activity suggests that buyer demand remained active as the market entered August. Not every pending contract is guaranteed to close, but the figure is an encouraging indicator of near-term activity.
Available Housing Inventory Declined
Active inventory fell to approximately 2,486 properties, down 27.9% from July 2025. Cape Coral had an estimated 4.9 months of supply, compared with approximately 7.8 months one year earlier.
A market with roughly four to six months of supply is commonly considered balanced. Cape Coral is therefore no longer experiencing the same degree of excess inventory that previously gave buyers a substantial advantage. Conditions still vary according to asking price, property condition, flood zone, insurance cost, waterfront classification, location, listing history and competition from new construction.
Sellers Received Closer to Their Asking Prices
Homes sold for a median of approximately 97.9% of their final asking price. On a $400,000 final list price, that equates to approximately $391,600.
This ratio compares the sale price with the property’s final asking price—not necessarily its original price. A home may have undergone one or more reductions before attracting a buyer.
Approximately 21.7% of active Cape Coral listings had expired, been withdrawn or been terminated during the preceding 12 months. Previously listed homes that eventually sold required a median of 208 combined days on the market, compared with 47 days for successful first-attempt listings. Accurate initial pricing remains extremely important.
August 2026 Cape Coral Market Direction
Because August has not yet concluded, a reliable full-month comparison is not available. The completed July results entering August point toward lower inventory than one year ago, improving pending activity, continued demand for correctly priced homes and a relatively balanced overall market.
Late summer generally brings fewer seasonal buyers to Southwest Florida. Serious buyers may encounter less competition, while motivated sellers may be more willing to consider reasonable offers, closing-cost assistance or other favorable terms. The greatest negotiating room is generally found among older, overpriced or previously listed properties.
The Cape Coral Waterfront Market
Waterfront properties must be evaluated separately from citywide statistics. Values can change considerably based on freshwater versus saltwater frontage, Gulf access, bridge height and number of bridges, boating distance, seawall condition, dock and lift condition, canal width, exposure, flood elevation, insurance requirements, age, storm protection and overall condition.
Two homes with similar living area can have dramatically different values because of their boating access and waterfront characteristics. Broad online estimates should not replace a property-specific analysis for Cape Coral waterfront homes.
What This Market Means for Cape Coral Buyers
Buyers still have meaningful opportunities, but declining inventory means the best homes may not remain available indefinitely. Well-priced, updated properties in desirable locations can move quickly. Greater negotiating leverage is more likely when a home has substantial market time, several price reductions or a prior expired listing.
Before making an offer, buyers should investigate insurance costs, flood-zone requirements, roof age, permit history, assessments and the property’s complete listing history.
What This Market Means for Cape Coral Sellers
The latest numbers are encouraging for homeowners, but the market remains price sensitive. Clean, properly prepared and professionally marketed properties supported by recent comparable sales are in the strongest position.
Sellers who begin substantially above market value risk accumulating market time and may ultimately sell for less than they could have achieved with a realistic initial price.
Cape Coral Real Estate Market Outlook
Cape Coral entered August with stronger sales, higher pending activity, reduced inventory and improving price measurements. The overall market is best characterized as balanced, although conditions vary greatly by location, property type and price range.
Buyers retain negotiating opportunities, particularly on stale or overpriced inventory. Sellers benefit from fewer competing listings but must still prepare, market and price their homes correctly.
Market Data Sources
Every buyer and seller's situation is different. My goal is to help you compare communities and properties based on your lifestyle, financial objectives and long-term plans—without unnecessary sales pressure.
Scott Meadows
Broker Associate
Premiere Plus Realty
Phone: 239-220-1157
Email: ScottMeadows3@gmail.com
Website: FloridaCustomHomes.com
Today's Florida Home - Southwest Florida Real Estate News and information.

Market statistics are provided as a general overview and are not a valuation of any individual property. Market conditions and property values vary by location, condition, waterfront access, flood zone, insurance requirements and other property-specific factors.